
GIS Experience

Using Digital Elevation Models (DEMs) I conducted a common surface analysis model deriving contour lines, slope, aspect, and hillshade from the DEM to run a habitat suitability model that identifies potential surveillance points for denning sites for Wolverines. Additionally, I calculated the visible areas from two possible research observation points, and to estimate the best areas of wolverine habitat in the area.
During this project, I gained skills using ModelBuilder for ArcGIS Pro.
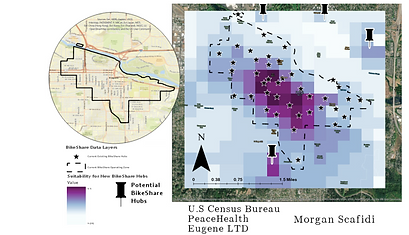
Working with Peacehealth bikeshare, I conducted a weighted sum overlay analysis on ArcGIS Pro to help determine where it would be most beneficial to build new hubs in order to engage more underserved populations in bimodal transportation.
When conducting my analysis with my layers, I prioritized specific layers over others in order to attain the most valuable results for this study.
I used Grocery Stores, LTD Stops, Businesses with an employee count, Addresses, and current BikeShare hubs as my layers.
This project helped me develop crucial data analysis skills, including troubleshooting, creativity, cartographic design, with real-world implementations.
Collaborated with UNT Dallas College of Law and Southern Dallas Progress to illustrate specific ZIP Codes in Southern Dallas in order to equip the Southern Dallas community with the information and resources required to resolve real property ownership barriers.
This project helped me gain skills in SQL coding and I become more comfortable speaking with the county commissioner in Dallas to hear the vision of what they needed and made it come to life.


Generated a cost surface & path surface analysis in order to find the safest and most efficient route to search for a missing mushroom hunter in the Willamette National Forest. This better equipped me with the skills to work in a fast-paced environment under pressure and develop crucial decision making skills.

By experimenting with spatial joins and buffers, I was able to use zoning, urban trail, parks, and land-use layers to find the ideal parcel of undeveloped land for a family in Austin, TX to build their new home on a parcel of currently vacant land. I developed skills in how to interpret meta-data, critical thinking, and initiative.
Conducted an OLRS and GWR model on ArcGIS Pro to prove my hypothesis that people living in poverty are more exposed to environmental hazards. This required running predictive modeling and statistical analysis to create a final piece of cartography supported by other infographics. The map shown uses Co2 emissions data from the EIA and Poverty data provided from the Census Bureau.

-
Develop a unique conference theme and form an extensive 6-month plan to execute the successful conference.
-
Schedule meetings for the committee to enforce strict deadlines as well as monitor colleagues' progress in their department.
-
Assess abstracts of GIS presenters to help implement relevant curriculum.

Provided a reference map for the US Census Bureau as well as Natural Earth Data. I learned skills in data scrubbing, typology, and manual annotations.